Ethereum ETH price regained its bullish trend against Tether (USDT) as it builds more strength to break above the key resistance ahead of “The Merge.” ETH price saw a rejection to a region of $1,500 recently as it could not hold its bullish trendline acting as support. (Data from Binance)

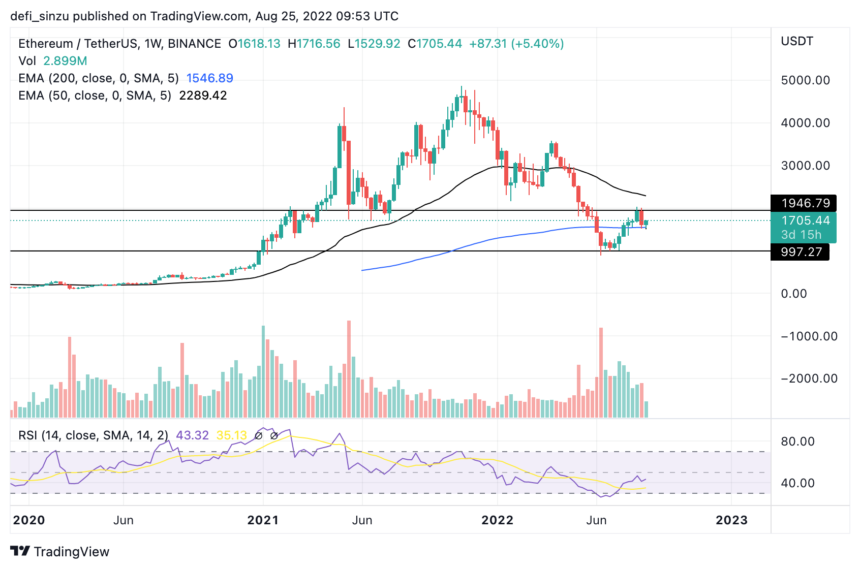
From the chart, the price of ETH saw its price rejected to a region of $1,540 on the weekly chart as the price was unable to hold $1,700 and the trendline acting as support for ETH price.
ETH weekly candle closed with a bearish sentiment, with the new week’s candle looking bullish for price recovery.
The price has continued to gain traction, outperforming Bitcoin’s (BTC) as ETH price shows strength, trying to flip resistance into support for the price to trend higher.
If the price of ETH on the weekly chart maintains this structure, it could quickly trend higher to a region of $1,800, acting as the weekly resistance for the price. To avoid falling below, the price of ETH needs to hold this support zone at $1,700.
Weekly resistance for the price of ETH – $1,800.
Weekly support for the price of ETH – $1,700, $1,600.

With more buy orders, the price of ETH would continue to trend to the upside after forming support above the uptrend line holding ETH price. ETH holding its price above this trendline will help it trend higher.
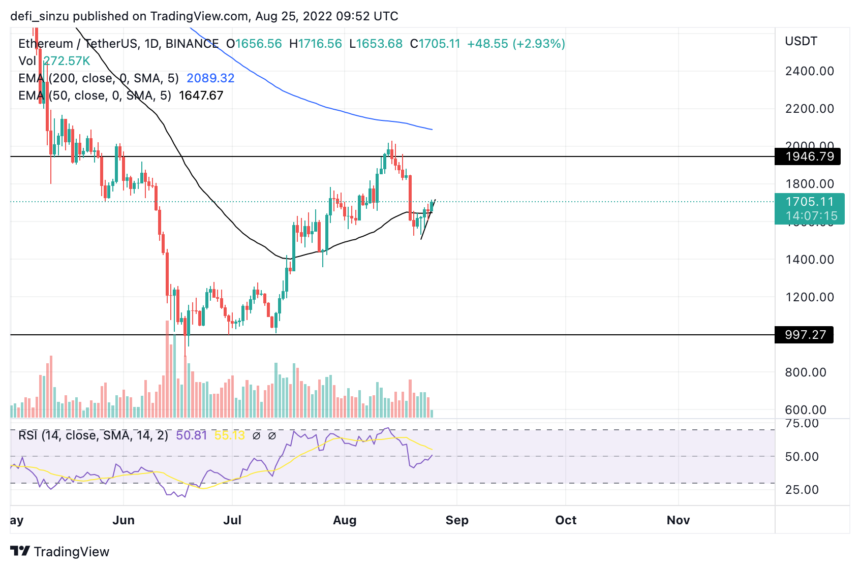
To confirm the bullish sentiment of ETH, the price bounced with good buy volume after seeing a retracement below its rising wedge.
The price of ETH has shown a bullish structure after breaking out, forming a bullish trend; if bulls step in, the price of ETH could trend higher to a region of $1,800-$2,000 acting as key resistance on the daily timeframe.
ETH is currently trading at $1,703, just above the 50 Exponential Moving Average (EMA), which corresponds to a price of $1,650 acting as support for ETH.
On the daily chart, the Relative Strength Index (RSI) for the price of ETH is above 50, indicating more buy orders.
Daily (1D) resistance for ETH price – $1,800-$2,000.
Daily (1D) support for ETH price – $1,650.

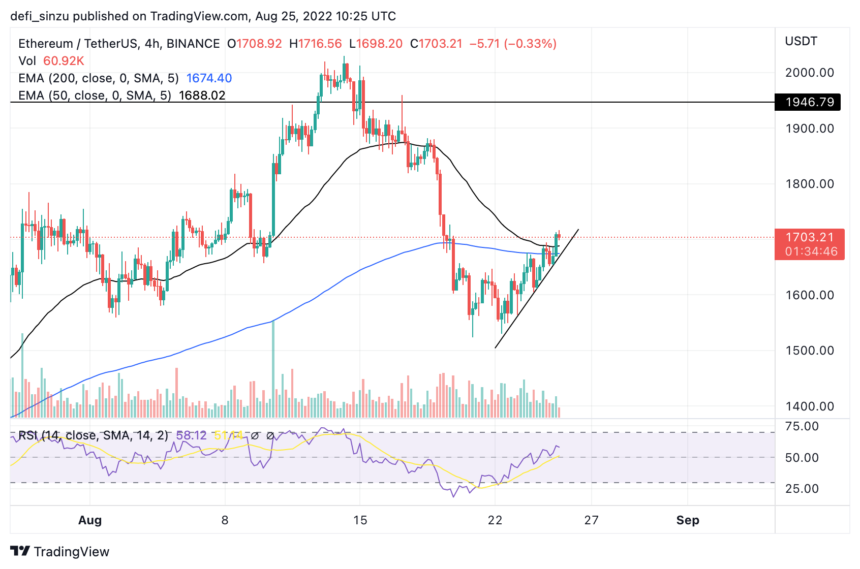
The price of ETH has continued to show a bullish trend holding above the 50 and 200 EMA prices, which correspond to $1,690 and $1,670, acting as support respectively to the ETH price.
ETH needs to hold above the 50 and 200 EMA to continue its bullish sentiment; if ETH fails to hold, the prices of $1,690 and $1,670 will act as support levels.
The price of ETH respects the uptrend line formed by prices as the trendline acts as support in case the 50 and 200 EMA can not hold the price of ETH during a sell-off.
Four-Hourly (4H) resistance for ETH price – $1,800-$2,000.
Four-Hourly (4H) support for ETH price – $1,690-$1,670.
Previous article


Copyright © 2022.AssessCrypto All rights reserved.