Raydium Springs Up From Underwater, Could This Be A Ray Of Hope?

The price of Raydium (RAY) drops to $0.7 against Tether (USDT) from its all-time high of $15 as it eyes to bounce from its low. Despite the relief bounce across most crypto assets, the price of Raydium (RAY) has continued to remain dormant at its all-time low. (Data from Binance)
Raydium (RAY) Price Analysis On The Weekly Chart
The price of RAY crashed to its low of $0.7 by over 95% from a high of $15 after seeing several rejections from areas of resistance.
RAY has shown little bullish moves on the weekly chart, as this could suggest a bullish move could happen in no distant time. With bulls buying RAY at this valued price, we could see the price going to $3.5, acting as the next significant resistance for RAY’s price.
If there are no buy orders, we could see the price of RAY range between the values of $0.55-$0.7 as these prices act as support areas.
If the price of RAY maintains its current structure, we could retest the resistance at $2.5-$3.5, depending on the buy volume orders.
Weekly resistance for the price of RAY – $0.25-$0.35.
Weekly support for the price of RAY – $0.55-$0.7.
Price Analysis Of RAY On The Daily (1D) Chart

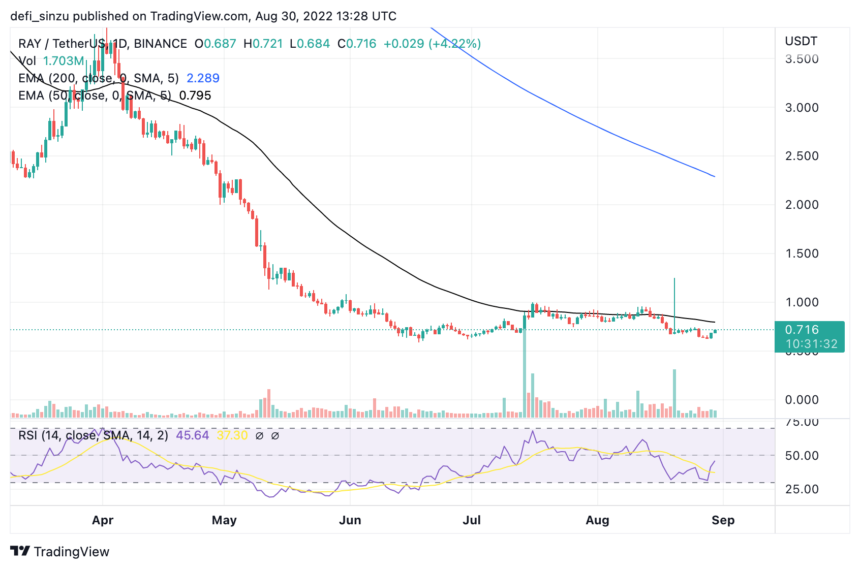
The price of RAY found its daily low at $0.6 and quickly bounced off the area where it has formed good support. RAY’s price moved to a region of $0.7 but could not sustain its movement as it continued to range.
Despite showing a great momentum sign, RAY is trading at $0.714 below the 50 and 200 Exponential Moving Averages (EMA), acting as resistance for the price of RAY to break higher.
The 50 and 200 EMA correspond to prices of $0.8 and $2.2, respectively; for RAY to trend higher, it must break through this region, which acts as resistance for RAY prices.
A break and close above the 50-day moving average would indicate a short-term relief bounce, while a close above the 200-day moving average would indicate a downtrend reversal to the upside of the current bearish trend.
If the price of RAY fails to break the resistance at $0.8, it may fall to the lower region for price accumulation at $0.6.
Daily (1D) resistance for RAY price – $0.8, $2.2.
Daily (1D) support for RAY price – $0.6.
Price Analysis Of RAY On The Four-Hourly (4H) Chart

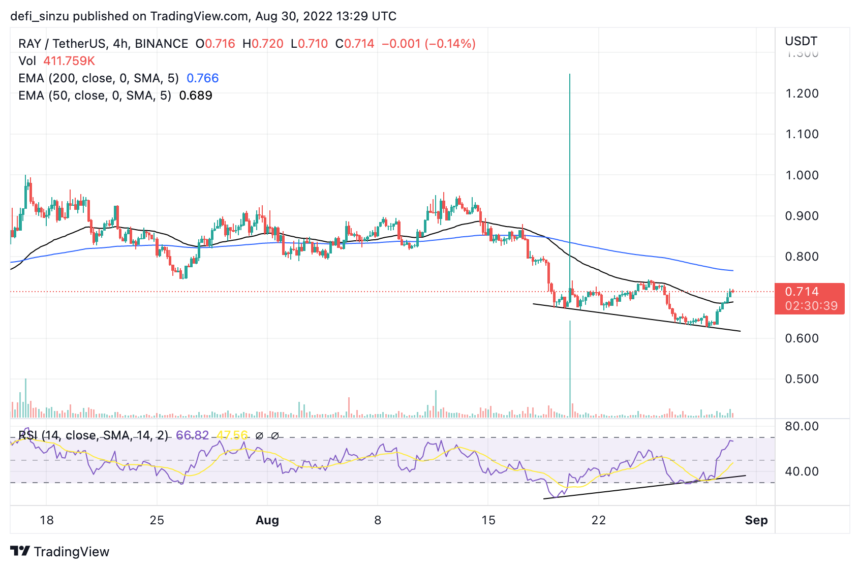
The price of RAY on the 4H chart has continued to look bullish, holding above the support area at $0.7, corresponding to the 50 EMA on the 4H chart with more buy orders in this region.
RAY formed a bullish divergence on the 4H chart as the price was oversold; we could see the price of RAY going to the resistance at $0.8.
The Relative Strength Index (RSI) for RAY on the 4H chart is above 60, indicating good buy volume for RAY price.
Four-Hourly (4H) resistance for RAY price – $0.8.
Four-Hourly (4H) support for RAY price – $0.68.
This article is authorized for publication, and unless the source is indicated, it is submitted by users and does not represent the position of our website. If the content involves investment suggestions, it is for reference only and not as an investment basis.


