Solana Price Fails To Break $34 Again, What Could This Mean?

- SOL price trades below 50 and 200 EMA on the daily timeframe despite showing some relief strength.
- SOL rally caught short as BTC price continued to range.
- The price must hold $30 support or face a drop-down to a weekly low.
The price of Solana (SOL) has recently shown some bullish strength, but it has struggled to break above key daily resistance against tether (USDT). Solana (SOL) prices have continued to fluctuate as bulls and bears play chess with SOL. SOL’s lack of bullish strength has left many traders and investors perplexed as to where it might go next. (Data from Binance)
Solana (SOL) Price Analysis On The Weekly Chart

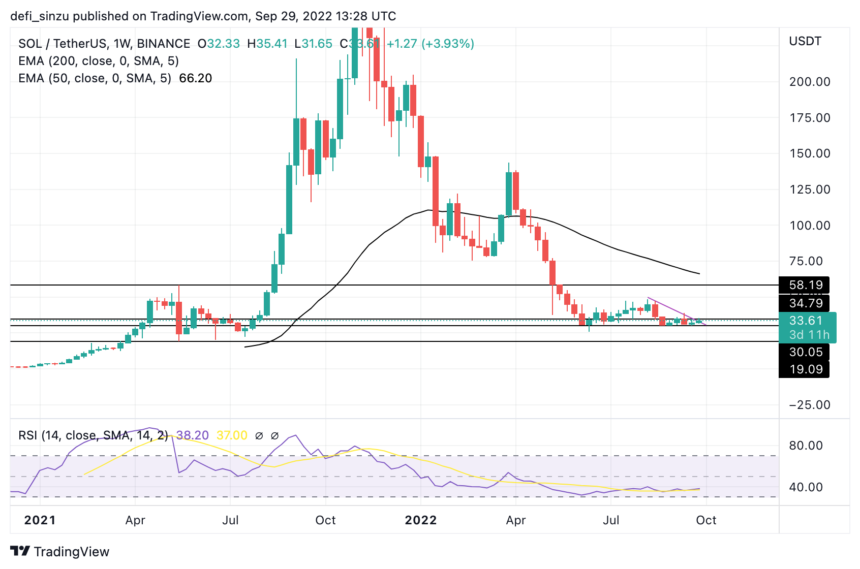
After bouncing from its weekly low of $30 as a price rally to a high of $45 before facing a stip rejection, the price of SOL has recently declined, and the price has continued to struggle to rejuvenate its bullish trend.
The price of SOL remains marginally above a key support level of $30; this level of support is acting as a good demand zone for buy orders. For SOL to have a chance to trend higher, the price must break through its weekly resistance of $35.
To restore a relief bounce, the price of SOL must break and hold above the $35 resistance with good volume. This area of resistance has kept the price of SOL from rising. If the price of SOL continues to reject $35, we could see a retest of $30 support and possibly a lower support area of $24 on the weekly chart if there is a sell-off.
If the price of SOL breaks and holds above $35, it could spark a major rally to a region of $45-$58, which has historically been a difficult area for SOL price to break out of.
Weekly resistance for the price of SOL – $35.
Weekly support for the price of SOL – $30.
Price Analysis Of SOL On The Daily (1D) Chart

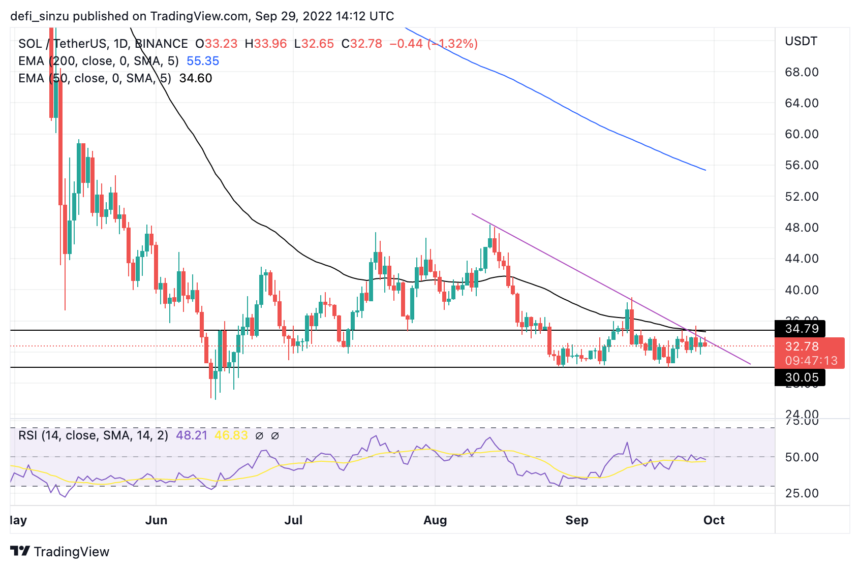
In the daily timeframe, the price of SOL remains below key resistance as it attempts to break above higher levels.
After forming a downtrend line that acts as a resistance for SOL price, the price of SOL has shown strength as it faced rejection in an attempt to break out of its downtrend range.
SOL’s price is $33 below the 50 and 200 Exponential Moving Averages (EMA). On the daily timeframe, the prices of $35 and $55 correspond to the prices at the 50 and 200 EMA for SOL.
A break and close above $35 could see the price of SOL rally high to a high of $45 and higher.
Daily resistance for the SOL price – $35-$45.
Daily support for the SO price – $30.
This article is authorized for publication, and unless the source is indicated, it is submitted by users and does not represent the position of our website. If the content involves investment suggestions, it is for reference only and not as an investment basis.


